This report is also available as a PDF: Income Inequality in Oregon Notched New Record Prior to COVID-19 Crisis
Before the COVID-19 pandemic upended the economy, the income of Oregon’s ultra-rich had set yet another record. In 2018, the year with the most recently available data, the average income of the richest 0.1 percent — the top one-tenth of 1 percent — rose to more than $5 million, the highest ever. Never had the richest Oregonians reported so much income.[1]
Though the corrosive effects of vast income inequality have been clear for some time, COVID-19 has provided a stark reminder of the instability and damage inequality produces.[2] Perhaps most obviously, the concentration of income among a relative few left large portions of Oregonians without the means to save and be prepared to weather the economic downturn.[3] Meanwhile, the nation’s billionaires have seen their combined wealth jump by $845 billion since the pandemic struck.[4] Oregon’s own Phil Knight saw his wealth rise by more than $16 billion this year alone.[5]
Economic inequality, including income inequality, remains the greatest economic challenge facing Oregon today. Lawmakers must avoid exacerbating income inequality and enact policies that reduce inequality, to ensure all Oregonians have the opportunity to flourish.
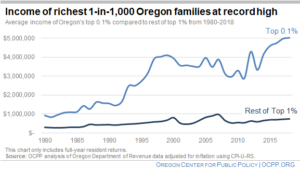
The income of those at the very top of the income ladder — the highest earning 1-in-1,000 Oregonians — is at an all-time high, after adjusting for inflation. To be among the 1,819 households in this group in 2018 (the tax year with the most recent data), a taxpayer needed to earn at least $1.8 million.[6] The average income of this top group was over $5 million, the highest on record, and five times their inflation-adjusted average income of $930,000 in 1980. While this tiny group largely fueled the rise of the top 1 percent as a whole, the rest of the top 1 percent saw their average inflation-adjusted income more than double between 1980 and 2018.[7]
What about race or wealth?
The use of tax return data limits the ability to report on key aspects of economic inequality in Oregon, particularly racial disparities and wealth inequality.
Tax forms do not ask taxpayers to identify their race or ethnicity, preventing a direct analysis of income inequality by race and ethnicity. Surveys such as those produced by the U.S. Census Bureau show large racial disparities in terms of income.[8] Unfortunately, census data does not allow for a granular look at the incomes of the very rich. Analyzing changes to the income of the top 1 percent and top 0.1 percent requires detailed information available from tax data.
This analysis focuses on income, not accumulated wealth. Income refers to a person’s annual earnings. Wealth, on the other hand, is the value of all assets (such as homes, stocks, and bonds) a person owns, minus all debts. While there is no reliable data source for the distribution of wealth at the state level, analysis at the national level shows that wealth is even more concentrated at the top — and in the hands of white people — than income.[9]
Economic inequality by race is the result of generations of racist structures and policies designed to boost the income and wealth of white people and put barriers in the way for Black, Indigenous, and other people of color.
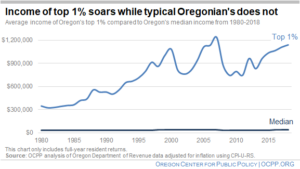
To be among the top 1 percent of earners in Oregon in 2018, a taxpayer had to earn at least $441,700. Their average income was $1,139,000 that year, more than triple its inflation-adjusted average income in 1980 of $348,000. Meanwhile, the income of the typical (median) Oregonian stagnated. The median Oregon income was $38,800 in 2018, only $3,400 higher than in 1980, after adjusting for inflation.
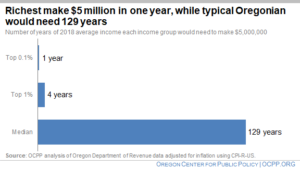
How long would it take for Oregonians at different levels of income to make $5 million? For the average member of the top one-tenth of 1 percent, it would take a bit less than one full year.[10] For the average member of the top 1 percent of Oregonians, it would take a little more than four years. The typical (median income) Oregonian, on the other hand, would need to toil for 129 years at the 2018 earnings level to make $5 million.[11]
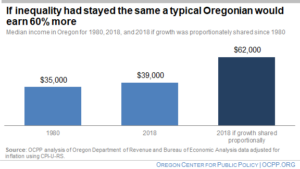
Incomes were unequal in 1980s, but much less so than now. If income inequality had not grown from 1980 to 2018 — if Oregon’s economic growth over that period had been shared proportionally at all income levels — then the typical Oregon taxpayer would have earned nearly $23,000 more in 2018.[12] The income of the median taxpayer would have totaled about $62,000, rather than the actual median income of $39,000 for 2018. In other words, the taxpayer in the middle would have earned over 60 percent more. At the same time, the income of the average member of Oregon’s top 1 percent would have been $608,000, instead of $1.1 million, had inequality stayed at the same level as in 1980.
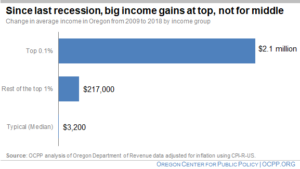
Income inequality rebounded sharply following the end of the prior recession, “The Great Recession,” which officially ended in 2009. Since then, the average income of the top one-tenth of 1 percent in Oregon increased by about $2.1 million, after adjusting for inflation. It would take the typical Oregonian 53 years to make that much money. The average member of the top 1 percent as a whole saw their income increase by about $217,000. Over that same time period, the typical Oregonian saw a $3,200 increase in income.
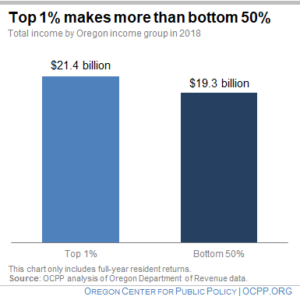
In 2018, Oregon’s highest earning 1 percent took in more income than the entire bottom half of Oregonians.[13]
That year, the top 1 percent together had income of $21.4 billion, equal to the lowest-earning 54 percent of Oregonians. The lowest-earning 50 percent of Oregonians, together, earned $19.3 billion.
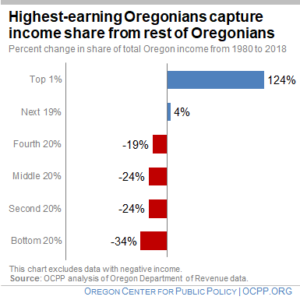
Oregon’s top 1 percent has seen their share of total state income more than double in recent decades, increasing by 124 percent from 1980 to 2018.
The bottom 80 percent of Oregonians saw declines in their share of total income over that same period.[14] The further down the income ladder, the more severe the decline in income share.
Besides the top 1 percent, the next 19 percent was the only other group to see an increase in its share of Oregon income. This group saw their share of income rise 4 percent from 1980 to 2018.
Conclusion
The income of the Oregon’s ultra-rich set a new record in the lead up to the COVID-19 pandemic — a crisis that has exposed the economic vulnerabilities of a large swath of Oregonians. This crisis underscores that income inequality remains “the defining challenge of our time.”[15]
[1] This fact sheet uses the terms “Oregonians” and “taxpayers” interchangeably. Unless otherwise noted, these refer to all Oregon income tax filers. In some instances, Oregon Department of Revenue data is only available for full-year resident income tax filers. In those instances, we note that the data is for full-year filers in the chart’s footer with an endnote.
[2] See Berg, Andrew G. and Jonathan D. Ostry, “Equality and Efficiency,” Finance & Development, Vol. 48, No. 3, September 2011; Ostry, Jonathan D., Andrew Berg and Charalambos G. Tsangarides, Redistribution, Inequality, and Growth, International Monetary Fund, February 2014; Boushey, Heather and Carter C. Price, How Are Economic Inequality and Growth Connected? A Review of Recent Research, Washington Center for Equitable Growth, October 2014; Ryder, Guy, Urgent Action Needed to Break Out of Slow Growth Trap, International Monetary and Financial Committee, International Monetary Fund, Thirty-Third Meeting, April 16, 2016; Dabla-Norris, Era, Kalpana Kochhar, Nujin Suphaphiphat, Frantisek Ricka, Evridiki Tsount, Causes and Consequences of Income Inequality: A Global Perspective, June 2015; “Trends in Income Inequality and its Impacts on Economic Growth,” OECD Social, Employment and Migration Working Papers, No. 163, OECD Publishing, 2014; Orrson, James, Income Inequality in America: A Call for Action and Effective Policy, White Paper, May 2015; Chetty et al. “The Association Between Income and Life Expectancy in the United States, 2001-2014”, Clinical Review and Education, 2016. On the intersection between the COVID-19 pandemic and economic inequality, see Heather Boushey and Somin Park, The coronavirus recession and economic inequality: A roadmap to recovery and long-term structural change, Washington Center for Equitable Growth, August 31, 2020.
[3] For example, in 2018 about 39 percent of Americans lacked enough savings or cash equivalents to cover an unexpected $400 expense, Report on the Economic Well-Being of U.S. Households in 2018 – May 2019: Dealing with Unexpected Expenses, Board of Governors of the Federal Reserve.
[4] Americans for Tax Fairness, “Billionaire Wealth Grew by $845 Billion, or 29%, as America Struggled Through First Six Months of Pandemic,” September 17, 2020.
[5] Estimates provided by the Institute on Policy Studies and Americans for Tax Fairness on September 17, 2020.
[6] Calculations for top one-tenth of 1 percent and the rest of the top 1 percent are based on total income for full-year returns because of limitations in data availability of other types of returns.
[7] The inflation-adjusted average income of the rest of the top 1 percent was $301,600 in 1980 and $747,900 in 2018.
[8] Oregon Center for Public Policy, A Dream Deferred, August 2015.
[9] Jesse Bricker, Sarena Goodman, Kevin B. Moore, and Alice Henriques Volz, “Wealth and Income Concentration in the SCF: 1989–2019,” FEDS Notes, Washington: Board of Governors of the Federal Reserve System, September 28, 2020; Neil Bhutta, Andrew C. Chang, Lisa J. Dettling, and Joanne W. Hsu, “Disparities in Wealth by Race and Ethnicity in the 2019 Survey of Consumer Finances,” FEDS Notes, Washington: Board of Governors of the Federal Reserve System, September 28, 2020.
[10] Data in this section includes only full-year returns because of limitations in data availability.
[11] This is similar to the more common comparison of worker to CEO pay, as in how many employees does it take to equal the pay of the CEO. See Mishel, Lawrence and Schieder, Jessica, Pay Remains High Relative to the Pay of Typical Workers and High-Wage Earners, Economic Policy Institute, July 2017.
[12] State economic growth from 1980 to 2018 was calculated using U.S. Bureau of Economic Analysis data for Oregon’s Gross State Product. This factor (175 percent) was then applied to the 1980 median income and top 1 percent incomes to determine the 2018 estimates if economic growth had been shared broadly, and income inequality had not widened, since 1980. This methodology is informed by, but does not mirror, the work of Carter C. Price and Kathryn A. Edwards, Trends in Income From 1975 to 2018, RAND Corporation, September 2020.
[13] Data in this section includes only full-year returns because of limitations in data availability.
[14] Tax returns with negative adjusted gross income have been excluded.
[15] President Barack Obama, “Remarks by the President on Economic Mobility,” December 4, 2013.