

Abstract
Ground-level ozone, which forms photochemically in the atmosphere from precursor emissions of oxides of nitrogen (NOx) and volatile organic compounds, is a criteria pollutant that harms human health and public welfare. For a representative summer episode, premature mortality and potential productivity losses (PPLs) of selected crops and trees attributable to ozone exposure have been quantified using ozone fields from the Community Multiscale Air Quality (CMAQ) model. We applied exposure-response models for the increased risk of premature mortality due to long-term exposure to ozone over a theoretical minimum risk exposure level (TMREL) and for the reduced accumulation of vegetative biomass for four crop species and eleven tree species using the W126 metric designed to capture impacts on plants. To elucidate which emissions contributed to these disbenefits, we applied adjoint-based sensitivity analysis, which efficiently estimates sensitivities of concentration-based metrics with respect to numerous emissions parameters simultaneously. The adjoint of CMAQ was applied to the continental US to calculate the influence of spatially-resolved ozone precursor emissions on the annual average, domain-wide daily maximum 8 h average over the TMREL (elevated MDA8), premature mortality attributable to exposure to ozone above the TMREL, and PPLs. These quantities provide the impact in terms of the percent reduction in precursor emissions. Additionally, locations where similar percent reductions in ozone precursor emissions would impact one or more endpoints greater than average have been identified. NOx emissions were found to contribute most to the three metrics. The distinct spatial patterns of emissions influences on public welfare disbenefits as compared to the elevated MDA8 and premature mortality suggest that the current regulatory averaging time motivates different emissions control strategies than those that could most directly protect public welfare.
Export citation and abstract BibTeX RIS

Original content from this work may be used under the terms of the Creative Commons Attribution 3.0 licence. Any further distribution of this work must maintain attribution to the author(s) and the title of the work, journal citation and DOI.
1. Introduction
Ground-level ozone, which is formed by reactions of oxides of nitrogen (NOx) and volatile organic compounds (VOCs) in the presence of sunlight, harms both human health (Penha and Werthamer 1974, Hackney et al 1976) and vegetative productivity (Roberts 1984, Ainsworth et al 2012). The US Environmental Protection Agency (EPA) has set National Ambient Air Quality Standards (NAAQS) for ozone to protect human health (primary) and public welfare (secondary) (US EPA 2015b). Accordingly, emissions controls to achieve the NAAQS are applied to sources of these precursor gases.
The health effects of ozone exposure on humans range from respiratory irritation to premature mortality. Bell et al (2005) correlated premature mortality with short-term ozone exposure. Jerrett et al (2009) identified a statistically significant relationship between long-term ozone exposure and death from respiratory illnesses when using observed daily maximum hourly ozone concentrations from 1 April to 30 September for the years 1977 through 2000 in an exposure model that included particulate exposure simultaneously. Recently, Turner et al (2016) investigated associations using downscaled estimates of ambient ozone, fine particulate matter, and nitrogen dioxide (NO2) concentrations across the US at 12 km resolution with more participants and a longer follow-up period. For every 10 ppb increase in annual average maximum daily 8 h average (MDA8) ozone mixing ratios, Turner et al (2016) observed an increase in the relative risk of all-cause mortality due to long-term ozone exposure of about 2%.
Using the exposure response models of Jerrett et al (2009) and Turner et al (2016), Malley et al (2017) estimated that 26 000 and 58 700 respiratory-related deaths, respectively, were attributable to ozone exposure over assumed low concentration cutoffs (LCC) in North America during 2010. Similarly, Liang et al (2018) estimated that 15 000 annual ozone-related deaths occurred due to respiratory complications in North America based on Jerrett et al (2009). The differences between the Malley et al (2017) and Liang et al (2018) estimates largely arise from the use of different model resolutions and baseline mortality data. Pappin and Hakami (2013) used the adjoint of the Community Multiscale Air Quality (CMAQ) model to establish linkages between sources of NOx emissions and two types of ozone metrics. The attainment-based metric was specific to American and Canadian regulations. The exposure-based metric reflected the premature mortality attributable to short-term ozone exposure based on Bell et al (2005). A domain-wide 10% uniform reduction in anthropogenic NOx emissions was found to avert 930 premature deaths from all causes due to reduced short-term ozone exposure in Canada and the US.
Ground level ozone also has decreased the productivity of crops (Heck et al 1966) and can damage other sensitive vegetation through long-term exposure (Lee et al 2003). Empirical exposure-response models of specific crop and tree species to ozone exposure established by studies in 1980s (Heck et al 1988) allow quantification of the potential productivity losses (PPLs) of sensitive vegetation that is exposed to specific concentrations of ozone over a growing season (Hogsett et al 1988). Peak ozone concentrations have been shown to impact plant productivity (Lee et al 1988); therefore, the concentration-based metric for exposure must capture the influence of high concentrations. In crop and tree studies in the US, Lee et al (1988) represented exposure with the W126 metric, which sigmoidally weights hourly ozone mixing ratios between 35 and 100 ppb by a factor between 0 and 1 during daylight hours through a 3 month growing season. Lee and Hogsett (1999) found a better correlation between the W126 metric and yield losses caused by ozone exposure compared to other concentration-based metrics. Other concentration-based metrics evenly weight concentrations above a threshold (e.g. AOT40) or during a number of daylight hours (e.g. M7 or M12). While likely more accurate (Danielsson et al 2013, Agathokleous et al 2018, Mills et al 2018), uptake-based metrics have yet to be developed for as many crops and vegetation types and are harder to monitor (Mills et al 2011, Zhang et al 2017).
Yue and Unger (2014) applied an offline, process-based vegetation model to assess the impacts of ozone-induced vegetative damage on gross primary productivity (GPP) in the US from 1998 to 2007. They found that ozone damage decreases GPP by 4%–8% on average in the eastern US. Also, their sensitivity simulations showed that the average GPP damage decreases to only 2%–4% with a 25% decrease in surface ozone concentration, which suggests the substantial ecosystem co-benefit of ozone air pollution control. Lapina et al (2014) quantified the contribution of emission sources to the W126 ozone metric using the GEOS-Chem adjoint model (Henze et al 2007). With the GEOS-Chem adjoint, Lapina et al (2016) estimated the impact of emissions sources from different locations, species, and sectors on relative yield loss (RYL) for crops or relative biomass loss (RBL) for ponderosa pine and quaking aspen tree seedlings as a function of ozone exposure using two cumulative metrics (W126, AOT40) and one mean metric (MX) for total ozone exposure. Lapina et al (2016) quantified the role of state-level emissions in contributing to these damages and contrasted these with the magnitude of the damages occurring in each state, highlighting the importance of interstate pollution transport. Capps et al (2016) estimated the potential productivity co-benefits for crops and trees from reduced ozone if carbon emissions standards were established for coal power plants in the US. As much as 16% and 13% decreases on an annual basis in PPL for corn and tulip poplar, respectively, were found as the co-benefits of a regulation that was designed to reduce carbon dioxide emissions from power plants.
For the first time to the knowledge of the authors, we apply adjoint sensitivity analysis at high resolution to compare the spatial distributions of contributions from different ozone precursor emissions to MDA8, premature mortality, and potential crop or biomass loss due to ozone exposure. Simultaneous evaluation of the impacts of emissions on these end points provides a unique assessment of the use of a single averaging time for the standards designed to protect human health and public welfare.
2. Method
2.1. CMAQ adjoint
We apply the adjoint of CMAQ (Sandu and Sander 2005, Hakami et al 2007), which provides the influence of each emissions parameter on a concentration-based metric to numerical precision with a linearized approximation. The CMAQ adjoint is used to quantify the relative influence of location- and species-specific emissions on selected concentration-based metrics for the year 2007. Changes in emissions rates since then may impact the concentration-based metrics as well as the emissions-based gradients but the underlying principles of the analysis are unaffected. Details of the model configuration and inputs, which are the same as those used by Turner et al (2015a, 2015b), are provided in section S1.1, which is available online at stacks.iop.org/ERL/14/124093/mmedia. The modeled annual MDA8 compared reasonably well against observations (section S1.1.1).
2.2. Adjoint mechanics and application
Adjoint-based emission gradients,  are the sensitivities quantified by the adjoint model. The cost function,
  may be composed of any concentration-based metric. The emissions of ozone precursors,
  are species-, location-, and time-specific, where
  is the species index,
  is the grid cell index, and
  is the hourly time index. The calculations of adjoint-based emission gradients are explained in section S1.2.
The linear approximation of the influence of ozone precursor emissions on various nonlinear functions is inherent in this approach to quantifying spatially-resolved influences of emissions. The sensitivity of the cost function with respect to the absolute emissions,  can be understood as the influence of changing the modeled emission levels. Previous studies suggest that MDA8, mortality, and PPL responses to precursor emissions remain near-linear for changes of up to 30% from modeled levels of emissions (Hakami et al 2003, 2004, Cohan et al 2005, Lapina et al 2014). Semi-normalized sensitivities,
  and normalized sensitivities,
  can be multiplied with a fractional change in emissions to quantify the absolute and relative change, respectively, in the cost function. In this study, we evaluate the impacts of domain-wide, uniform 10% reductions in ozone precursor emissions, which preserves the assumption of linearity. For each grid cell, any emission reduction of less than 30% would have an estimated impact proportional to the 10% reduction shown because the same semi-normalized or normalized sensitivities would be multiplied by the alternative reduction. For instance, with 5% reductions (section S2.4) the impacts of the reductions are half of those of the 10% reductions. The cost functions applied are the regulatory ozone averaging time, ozone-related premature mortality, and ecosystem impacts of ozone. Uncertainties in exposure-response models, atmospheric modeling, and emissions inventories, which are for the most part unquantified, affect the precision and accuracy of these results. Future work to develop computationally efficient tools for uncertainty quantification with adjoint-based sensitivities would also be required to characterize the impacts of the uncertainty in these model parameters if they were fully quantified.
2.2.1. Premature mortality
Increased premature mortality due to ozone exposure is represented with the exposure-response model for ozone-related premature mortality of Turner et al (2016) (equation (1)). The cost function is the annual continental US premature mortality attributable to ozone exposure above a theoretical minimum risk exposure level (TMREL) (Lim et al 2014, Cohen et al 2017, Liang et al 2018),  defined as

where N is the number of grid cells,  (deaths/year) represents the gridded annual non-accidental baseline mortality in the US for people age 30 or older in 2010 (output from BenMAP, US EPA 2013), and
  (ppb) is the gridded annual mean of the MDA8 ozone,
  over the TMREL. The concentration response factor,
  is 0.0198 per 10 ppb, which corresponds to the findings for all-cause mortality increases due to long-term ozone exposure (Turner et al 2016). For each grid cell,
  is calculated as:
The value of the TMREL for the annual average MDA8 is set at 28.9 ppb by taking the average of the two LCC values for North America that are estimated based on Turner et al (2016), in which the annual average MDA8 is also used as the exposure metric (Malley et al 2017, Liang et al 2018).
2.2.2. Elevated MDA8 ozone
The elevated MDA8 cost function is the annual and spatial average of MDA8 ozone in the grid cells when and where the annual average MDA8 is above the TMREL. MDA8 ozone less than 28.9 ppb is likely to come from outside the domain (US EPA 2015a), which limits the opportunity for emissions controls to be evaluated with a regional model.
2.2.3. Crop and vegetation impacts
Public welfare encompasses the annual ozone-related PPLs of selected crop and tree species in the US. First, we calculated W126, a cumulative ozone exposure metric, which is representative of dose for vegetation (equation (3))
where  is the day of the growing season, which is modeled as June, July, and August. Then, the PPL of a specific crop or tree species is given by
where  is the crop and tree species index and
  and
and  are crop and tree species-specific parameters that are empirically determined (Lehrer et al 2007) (table S1). The crop species include potato, soybean, cotton, and corn. The tree species studied are eastern cottonwood, black cherry, tulip poplar, quaking aspen, ponderosa pine, eastern white pine, Virginia pine, red maple, red alder, sugar maple, and Douglas fir. The productivity of the crops and biomass of tree species,
  was spatially allocated using publicly available data sets from the United States Department of Agriculture (USDA) and the USDA Forest Inventory Analysis (section S1.2.1). Although crop and timber PPL concentration-based exposure-response functions developed in experiments may not work identically for field conditions (section S1.2.1), they are more readily available because they are easier to develop, and they are more straightforward to use with an adjoint compared with uptake-based metrics. For vegetation for which uptake-based models have been developed, future work to develop the adjoint of an uptake-based exposure model may provide an informative comparison with this concentration-based adjoint forcing.
3. Results
Conducting sensitivity analysis with the CMAQ adjoint using three distinct ozone-based cost functions demonstrates the degree to which ozone precursor emissions influence elevated MDA8 ozone, human health, and public welfare differently.
First, the semi-normalized sensitivities are multiplied by a domain-wide, uniform 10% reduction in emissions to calculate the contributions to the elevated MDA8 ozone and premature mortality of this portion of the modeled emissions (figure 1). A 10% domain-wide uniform reduction in VOC and NOx emissions reduces the elevated MDA8 from 42.23 ppb by 0.13 ppb and 0.04 ppb from NOx and VOC emissions reductions, respectively. The annual premature mortality attributable to ozone exposure over the TMREL in the continental US is estimated to be 65 800 deaths. The VOC and NOx emissions reductions decrease premature mortality by approximately 550 and 340 deaths, respectively. The greater contribution from VOC to mortality despite a smaller contribution to elevated MDA8 is due to more people dwelling in VOC-limited areas. The domain-wide contributions of the 10% reductions of individual VOC emissions differ between thirteen anthropogenic VOC (AVOC) species and three biogenic VOC (BVOC) species (figure 1, left column). Amongst VOCs, isoprene emissions, which are primarily biogenic in origin, are the most influential on elevated MDA8 and premature mortality (figure 1, left column). Alkanes and terminal alkenes are the next most significant contributors, which suggests that controlling their emissions may be a strategic choice. The negative contributions, which were confirmed to be consistent with forward modeling, may arise from ozonolysis (section S2.1).
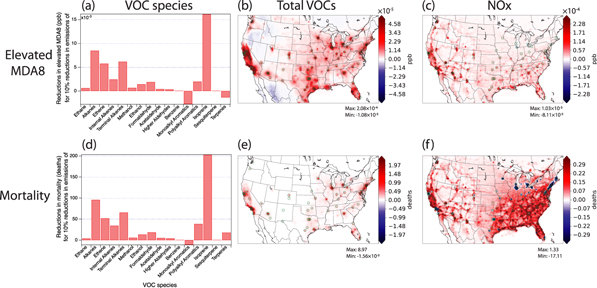
Figure 1. Contributions to reductions in elevated MDA8 ozone (upper row) and annual premature mortality (lower row) from 10% domain-wide uniform reductions in emissions of individual VOC species (left column), the weighted-sum of VOC emissions (middle column), and the weighted-sum of NOx emissions (right column). The individual VOC species in left column are ordered by the degree of reactivity and the number of carbon atoms. The thirteen VOC species on the left are anthropogenic VOCs (AVOCs), while the three VOC species on the right are primarily biogenic in origin (BVOCs). Data shown are summed over all the hours in the year. Positive numbers indicate a contribution to reducing ozone-based metrics, while the converse is true for negative values. The fifty most populous cities are marked by green circles.
Download figure:
Standard image High-resolution imageThe spatial distribution of influences of VOC and NOx emissions on elevated MDA8 and premature mortality have meaningful similarities and distinctions (figure 1, middle and right columns). Reductions in elevated MDA8 (figures 1(b), (c)) due to 10% reductions in all VOC emissions and 10% reductions in NOx emissions, each weighted by their respective emissions rates, show that emissions of VOCs and NOx occurring in cities contribute more to elevated MDA8 ozone than those from rural areas. These spatial patterns of contributions are similar for premature mortality (figures 1(e), (f)). An exception is that reductions in NOx emissions in cities, including Los Angeles, San Francisco, New York, Philadelphia, and Atlanta (figure S8), contribute very little to reductions in ozone-related premature mortality; in some locations, reductions in NOx emissions even increase local ozone concentrations and premature mortality by reducing the amount of ozone eliminated through titration (section S2.2). As many as 17 more deaths in the continental US can occur by reducing NOx emissions in a single grid cell in the urban center by 10% (figure 1(f)). Reductions in total VOC emissions contribute more to reductions in premature mortality than NOx reductions in these cities (figure 1(e)). Accordingly, the control strategy suggested for MDA8 ozone and premature mortality may involve reducing both VOC and NOx emissions in urban areas. Regionally, reductions in emissions of both VOCs and NOx from the western US, especially California, contribute more than those in the east, which likely reflects the higher value of MDA8 over California during this modeling episode and the more dominant westerly wind pattern.
Next, the RYL of potato, soybean, cotton, and corn are investigated (table 1). Total PPLs are calculated (equation (4)) and are divided by total productivity to give the RYL. Corn and soybean are two of the largest cash crops with 2007 production valued at $55 billion and $27 billion (2007 US dollars), respectively, while cotton and potato brought in an order of magnitude less each (http://quickstats.nass.usda.gov). Expressing RYL as a cost is an approximation because many factors may mitigate or exacerbate losses, including market dynamics. Nevertheless, the most straightforward aggregate metric for crop productivity for a historical episode is the production value. The RYL for corn was sufficiently low that it was neglected from further analysis.
Table 1. The relative yield loss (RYL), total productivity, and potential productivity loss (PPL) for each crop in 2007 (http://quickstats.nass.usda.gov) according to the exposure-response relationship of Lehrer et al (2007), ordered by the RYL.
| Crop (unit) | RYL (%) | Total productivity | Total PPL |
|---|---|---|---|
| Potato (cwt) | 3.76 | 4.29 × 10⁸ | 1.61 × 10⁷ |
| Soybean (bushels) | 3.57 | 2.73 × 10⁹ | 9.75 × 10⁷ |
| Cotton (bales) | 3.30 | 2.25 × 10⁷ | 7.43 × 10⁵ |
| Corn (bushels) | 0.15 | 9.95 × 10⁹ | 1.51 × 10⁷ |
Multiplying the semi-normalized sensitivities by domain-wide, uniform 10% reductions in emissions shows the spatially-heterogeneous contributions to increases in productivity, which are quantified as reductions in PPL, of each crop (figure 2, middle and right columns). This information along with spatially- heterogeneous PPLs (figure 2, left column) are valuable for investigating location-specific emissions control strategies. While the PPL shows where crops are harmed by ozone (figure 2, left column), the contribution maps show the degree to which reductions in emissions at each location over the three-month period contribute to reductions in PPLs of crops (figure 2, middle and right columns). For reductions in soybean PPL, many contributions are from reductions of NOx and VOC emissions in cities designated as ozone marginal nonattainment areas (figure S8) including Chicago, IL; St. Louis, MO and IL; and Louisville, KY and IN (US EPA 2019). The reductions of NOx and VOC emissions in other cities that are in attainment with the 2015 ozone standard (figure S8), including Indianapolis, IN, and Kansas City, MO, also contribute to increasing soybean productivity. Furthermore, interstate transport of ozone and its precursors contributes to PPL. For instance, Californian VOC and NOx emission reductions contribute to increased yield, which is a reduction in PPL, of soybeans, which are grown in the central US, not in California (figure 2, middle row).
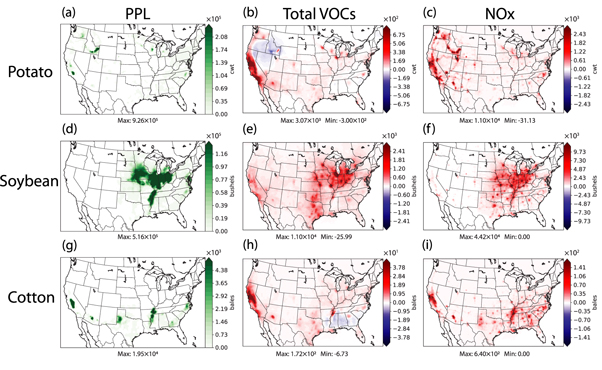
Figure 2. The annual potential productivity loss (PPL) (left column) as well as the contributions to reductions in PPLs of crops from 10% domain-wide uniform reductions in emissions of VOCs (middle column) and NOx (right column) for potato (upper row), soybean (middle row), and cotton (lower row). Data shown in middle and right columns are summed over all the hours in the three months.
Download figure:
Standard image High-resolution imageFinally, the influences of ozone precursor emissions to the PPLs of eleven tree species are quantified (table 2). Eastern cottonwood and black cherry trees were most influenced by reduction with an RBL of 57.8% and 18.8%, respectively, while others had single-digit RBLs less than 6%. Further analysis excludes species with RBL less than 1%.
Table 2. The relative biomass loss (RBL), total productivity, and potential productivity loss (PPL) for each tree species considered according to the exposure-response relationship of Lehrer et al (2007), ordered by the RBL.
| Tree species | RBL (%) | Total productivity (tons) | Total PPL (tons) |
|---|---|---|---|
| Eastern Cottonwood | 57.8 | 5.22 × 
|
3.02 × 
|
| Black Cherry | 18.8 | 3.06 × 
|
5.75 × 
|
| Tulip Poplar | 5.99 | 6.63 × 
|
3.98 × 
|
| Quaking Aspen | 4.15 | 3.94 × 
|
1.63 × 
|
| Ponderosa Pine | 3.03 | 9.36 × 
|
2.84 × 
|
| Eastern White Pine | 2.21 | 2.13 × 
|
4.70 × 
|
| Virginia Pine | 0.85 | 7.36 × 
|
6.24 × 
|
| Red Maple | 0.68 | 1.32 × 
|
9.04 × 
|
| Red Alder | 0.13 | 4.34 × 
|
5.59 × 
|
| Sugar Maple | 0.09 | 9.34 × 
|
8.05 × 
|
| Douglas Fir | 0.00 | 3.32 × 
|
7.59 × 
|
The PPL distributions illustrate the locations at which the trees are harmed by ozone (figure 3, left column). The spatially-heterogeneous contributions to reductions in PPL (increase in productivity) of uniquely distributed tree species from 10% domain-wide uniform reductions in emissions (figure 3, middle and right columns) can be used to investigate location-specific emissions control strategies. Interstate transport of ozone and its precursors contributes to PPL. For instance, reductions in NOx and VOC emissions from California contribute to the reduction in PPL of eastern cottonwood, which is more broadly distributed across the center of the country (figure 3, upper row). However, the local emissions are still influential, as is evident from the black cherry trees in western Pennsylvania benefitting most from reductions in NOx and VOC emissions from lower Michigan, Ohio, and western Pennsylvania (figure 3, middle row; figure S8). Similarly, the distribution of tulip poplar PPL across the southeast leads to more reductions in PPL from reductions of emissions in Atlanta, GA; upstate South Carolina; and the piedmont region of North Carolina (figure 3, lower row; figure S8).
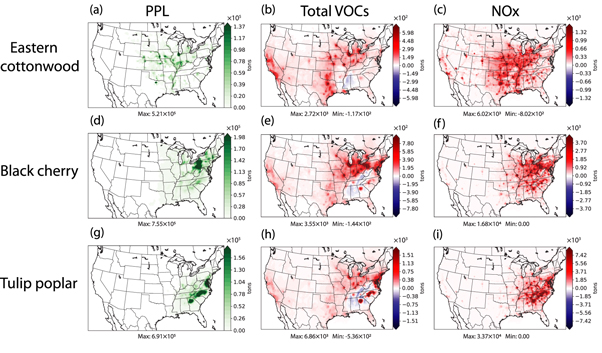
Figure 3. The annual potential productivity loss (PPL) (left column) as well as the contributions to reductions in PPLs of trees from 10% domain-wide uniform reductions in emissions of VOCs (middle column) and NOx (right column) for eastern cottonwood (upper row), black cherry (middle row), and tulip poplar (lower row). These three tree species are selected for illustration because of uniquely distributed productivity patterns. Data shown in middle and right columns are summed over all the hours in the three months.
Download figure:
Standard image High-resolution imageSide-by-side comparisons of the reductions in different cost functions that have different units and scales require the use of normalized sensitivities,  Multiplying the normalized sensitivities with a domain-wide, uniform reduction in emissions of 10%, and summing the products in time, in space, and across the precursors estimates the corresponding percent reductions in each cost function (figure 4, right axis). The elevated MDA8 is reduced by 0.41% with a 10% reduction in emissions while premature mortality has a 1.34% reduction. Crop and tree PPLs are reduced by an average of 7.67% across species with greater than 1% RYL or RBL (section S2.3). The minimum reduction was 4.89% for black cherry, and the maximum reduction was 10.78% for tulip poplar. Almost 76% of the reductions in elevated MDA8 arise from reductions in NOx emissions, while reductions of AVOC and BVOC emissions contribute 16% and 8%, respectively (figure 4, left axis). Contributions from reductions in emissions of NOx and AVOC to the reductions in premature mortality are greatest at 38% and 37%, respectively. The average contributions across all crop and tree species are 78% for NOx and 11% each for AVOC and BVOC.
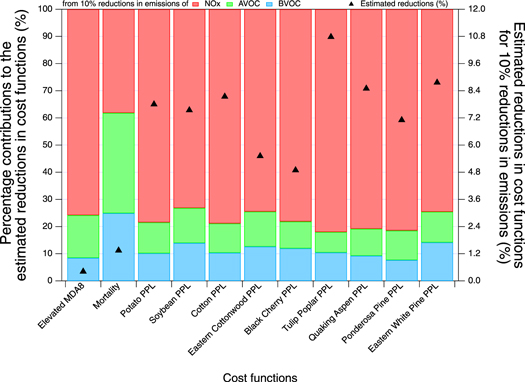
Figure 4. Percent contributions to the estimated reductions in cost functions from 10% reductions in emissions of NOx, AVOC, and BVOC (left axis, stacked bar). Estimated percent reductions in cost functions for 10% reductions in emissions (right axis, black marker). The data for elevated MDA8 and mortality cost functions are summed over all the hours in the year, while the data for crop and tree potential productivity losses (PPLs) are summed over all the hours in the three months.
Download figure:
Standard image High-resolution image4. Discussion
Quantifying the contribution of reductions in ozone precursor emissions from each location to reductions in elevated MDA8 ozone, premature mortality, and vegetative PPL with adjoint sensitivities allows for more detailed evaluation of potential emissions control strategies than using methods that do not provide the spatially-heterogeneous influences of emissions. Premature mortality estimates compare reasonably with previous global modeling results in the literature though our values are somewhat higher likely due to differences in the modeling frameworks (section S3.1). Vegetative PPLs and the influences of emissions on the W126 exposure metric also compare reasonably with previously published results (section S3.1).
For the first time, this study compares influences of location-specific AVOC and NOx emissions reductions in the continental US on elevated MDA8, premature mortality, and crop losses simultaneously (figure 5). Pappin and Hakami (2013) quantified emissions influences on nonattainment and exposure. They categorized emissions from specific locations as improving both metrics, improving only one metric, or improving one while degrading another. To compare control strategies motivated by reducing elevated MDA8, premature mortality, and vegetative PPLs, we categorized locations by the impacts on each endpoint that a 10% emissions reduction throughout the three months of the crop growing season would have (figure 5). We merge the PPLs of potatoes, soybeans, and cotton using their equivalent economic losses in US dollars in 2007 (http://quickstats.nass.usda.gov) (section S3.2). For each location, the categories reflect one of three responses of each ozone metric to the reductions in emissions, which are above average reduction, less than average change, and above average increase. Although twenty-seven different permutations are possible, only the most frequent categories are shown. We consider changes as less than average if their absolute values are below the absolute value of the spatially averaged change (section S3.3). Emissions that reduce the three metrics simultaneously are colored as red (figure 5), which include AVOC emissions from the west coast, eastern Texas (figure S8), and the industrial Midwest, as well as reductions in NOx emissions from regions in California, eastern Texas, Oklahoma (figure S8), Midwest, Southeast, and Northeast US. While reductions in AVOC and NOx emissions in the green regions surrounding these red regions have a less than average impact on the elevated MDA8, they reduce at least one of the other two metrics. Most regions in the modeling domain are covered by purple, which indicates less than average changes in all three metrics from 10% reductions in emissions of AVOC or NOx from these regions. The mortality and crop loss metrics would not change more than average for the 10% reductions in emissions from the yellow regions even though the elevated MDA8 would decline more than average. Reductions in AVOC emissions from regions colored brown in the Midwest and Southwest would reduce the elevated MDA8 and crop PPL metrics more than average but would not shift the mortality metric more than average. Finally, reductions in emissions from the gray regions, including but not limited to south Florida, Massachusetts, Connecticut, and Rhode Island (figure S8), reduce elevated MDA8 and mortality metrics more than average but not the crop loss because of the relatively great distance from production of the studied crops.

Figure 5. Simultaneous effects of 10% reductions from each grid cell in emissions of AVOCs (a) and NOx (b) on elevated MDA8 ozone (O), premature mortality (M), and crop losses (L). Here, crop losses are aggregated as the sum of economic losses associated with potential productivity losses (PPLs) of potatoes, soybeans, and cotton (section S3.2). Different colors imply different effects on the three metrics, which are denoted by r for above average reduction and n for less than average change. Above average increase is neglected (section S3.3). The data in this figure are summed over the three month growing season of crops.
Download figure:
Standard image High-resolution image
5. Conclusion
We applied the adjoint method to assess species- and location-specific contributions of emissions to health and ecosystem disbenefits in the continental US. We found that with a domain-wide, uniform 10% reduction in VOC and NOx emissions, 890 of an estimated 65 800 premature deaths attributable to ozone exposure over the TMREL (Lim et al 2014, Cohen et al 2017, Liang et al 2018) would be averted. Of these, reductions of VOC and NOx emissions were responsible for 62% and 38%, respectively. RYLs for potato, soybean, and cotton were greater than 3% while RBLs of eastern cottonwood, black cherry, and tulip poplar were 57%, 19%, and 6%, respectively. Reductions in NOx emissions were responsible for more than 78% of the average reductions in PPL though the contributions varied across species. Emission controls of AVOCs (NOx) implied greater than average reductions in MDA8 in 11% (14%) of grid cells in the continental US and help protect human health and public welfare. Reductions in AVOC (NOx) emissions from 7% (8%) of the grid cells influence the elevated MDA8 less than average but provide greater than average benefits for at least one of the other two metrics. Emissions controls of AVOCs (NOx) in 4% (6%) of the grid cells would not change the mortality and PPL metrics more than average though they would reduce the elevated MDA8 more than average. Future work to develop an adjoint of uptake-based exposure models for vegetation would allow spatial specificity in the emissions contributions to uptake-based impacts. As the results suggest, using MDA8 ozone as the averaging time of the primary standard is consistent with the emission control approaches that would be designed to protect human health, but using MDA8 ozone as the averaging time of the secondary standard motivates different emissions control strategies than would a unique metric for these aspects of public welfare (section S4).
Acknowledgments
DKH and AGR recognize support from NASA HAQAST NNX16AQ26G and NNX16AQ29G, respectively. AH and AGR recognize support from the Health Effects Institute. AH also recognizes support from the Natural Science and Engineering Research Council of Canada. The authors acknowledge Robert Pinder, Sergey Napelenok, and Jesse Bash from the US EPA for providing vegetative data and modeling support.
Data availability statement
The data that support the findings of this study are available from the corresponding author upon reasonable request.