


Abstract
Despite health benefits of physical activity (PA) and risks of physical inactivity, many older adults do not accumulate sufficient levels of PA to achieve associated health benefits. Lack of PA enjoyment may be a barrier to PA participation. Combining simulated laughter and PA for strength, balance, and flexibility is a potential solution for helping older adults maintain independence in activities of daily living through enjoyable participation in PA.
The purpose of this study is to assess whether combining simulated laughter exercises with a moderate-intensity strength, balance, and flexibility PA program (i.e., LaughActive) increases participation in PA, health, and self-efficacy for PA among older adults residing in 4 assisted living facilities (ALFs).
The 12-week wait list control pilot study used pre- and 6-week post-intervention comparisons within and between groups identified by paired sample t-test results among those who participated in twice-weekly LaughActive classes (n = 27).
Significant improvements (p < .05–.10) were observed in mental health (SF-36v2), aerobic endurance (2-minute step test), and self-efficacy for exercise (OEE).
PA programs that elicit positive emotions through simulated laughter have the potential to improve health, physical performance, and self-efficacy for PA among older adults and may positively influence participant adherence.
Regular physical activity (PA) is needed throughout the life course. Sufficient PA in older adult populations is associated with lower all-cause mortality and reduced risk of a number of chronic conditions, including coronary heart disease, high blood pressure, stroke, type 2 diabetes, metabolic syndrome, osteoporosis, colon cancer, breast cancer, anxiety, and depression (Nelson et al., 2007). Regular PA reduces the impact of age-related declines in aerobic endurance and the degenerative loss of muscle mass, quality, and strength, which prevents or mitigates functional limitations (Vogel et al., 2009). These benefits are crucial in the maintenance of older adults’ ability to perform activities of daily living (ADLs). Modest evidence supports the association of PA with enhanced sleep quality and health-related quality of life (HRQOL), whereas strong evidence supports the association between PA and higher levels of functional health, reduced risk of falls and lower incidence of hip fracture, and improved cognitive function (Nelson et al., 2007; U.S. Department of Health and Human Services [USDHHS], 2008).
Despite the health benefits of PA and the risks of physical inactivity, many older adults are not physically active and therefore do not accumulate sufficient levels of PA to obtain the associated health benefits. The 2008 Physical Activity Guidelines recommend that all adults participate in a minimum of 30 minutes of PA at least 5 days per week to counter the negative effects of inactivity and achieve desirable health outcomes (USDHHS, 2008). Acquiring sufficient levels of PA according to these guidelines requires that adults maintain motivation to adhere to regular PA, which often presents a particular challenge for the older adult population (Brawley, Rejeski, & King, 2003).
Enjoyable exercise programming may serve as a mediator to PA in older adults (Phillips & Flesner, 2013). Mullen and colleagues claimed, “Enjoyment is both a predictor and outcome of physical activity participation” (2011, p. 1). Participants that anticipate enjoyment as a part of PA can improve their commitment and adherence to exercise activities, due to anticipated positive emotions associated with the activities (Mullen et al., 2011).
It seems plausible that if participants who anticipate enjoyment as a part of PA can improve their commitment and adherence to exercise activities, then a program that specifically targets exercise enjoyment through eliciting positive emotions would motivate participants to participate in the program both initially and on a continuing basis. Laughter may be a valid part of the solution. The pleasant associations with laughter may add enjoyment to an exercise program and increase program adherence (Hirosaki et al., 2013).
Not only is laughter generally considered to be an enjoyable activity; laughter itself is associated with improved physiological and psychological functioning. Physiologically, laughter positively impacts the central nervous, muscular, respiratory, circulatory, endocrine, immune, and cardiovascular systems (Fry, 1986, 1992). The physical act of laughter shares many common benefits associated with exercise (Fry, 1994). A recent literature review confirmed the following physiological benefits of laughter: (1) exercises and relaxes muscles; (2) improves respiration; (3) stimulates circulation; (4) decreases stress hormones; (5) increases immune system defense; (6) elevates pain threshold and tolerance; and (7) enhances mental functioning (Mora-Ripoll, 2011). The physical benefits of laughter are complemented by the scientifically validated psychological effects of laughter, which are summarized as follows: (1) reduces stress, anxiety, tension, and counteracts depressive symptoms; (2) elevates mood, self-esteem, hope, energy, and vigor; (3) enhances memory, creative thinking, and problem solving; (4) improves interpersonal interaction and relationships and increases feelings of bonding; (5) increases friendliness, helpfulness, and builds group identity, solidarity, and cohesiveness; (6) promotes general psychological well-being; (7) improves quality of life and patient care; and (8) intensifies joy and is contagious (Mora-Ripoll, 2011).
It is important to distinguish between humor and laughter. “Humor and laughter are distinct events (although often associated): while humor is a stimulus and can occur without laughter, laughter is a response and can occur without humor” (Mora-Ripoll, 2011, pp. 173–174). Simulated laughter techniques such as laughter yoga achieve the health benefits of laughter without relying on humor to elicit the laughter stimulus. Simulated laughter techniques are based on knowledge that the body cannot distinguish between genuine and self-initiated laughter (Kataria, 2011). Although the laughter used in simulated laughter techniques is initially self-initiated, the laughter exercises facilitate the act of making eye contact and enacting playful behaviors with other participants, which generally transitions the laughter itself from laughter that is simulated to genuine laughter. Simulated laughter may lead to increased intensity and duration of laughter, both through intentionally self-initiating deep and prolonged laughter at will, and through transitioning into genuine and spontaneous laughter triggered through the eye contact and playful behaviors shared among participants. These two effects have the potential to result in increased physiological responses (Mora-Ripoll, 2011).
Simulated laughter may be an ideal means for older adults with functional or cognitive impairments to access the health benefits of laughter. Humor may lead to laughter, but it is elicited through a mental stimulus and therefore requires a high degree of mental functioning including attention, working memory, flexible thinking, extraction of word meaning, and a positive mood state in order to perceive and appreciate humor (Takeda et al., 2010). However, when laughter is self-initiated as bodily exercise, older adults do not need to rely on cognitive skills to “get the joke,” or a positive mood state to reap the benefits of laughter. Furthermore, laughter is universal. Nearly everyone enjoys laughing, and laughter is almost always positive; whereas, humor can sometimes be misjudged and elicit negative emotional responses. These benefits are especially relevant to older adults with moderate dementias (Takeda et al., 2010). Because simulated laughter exercises can be facilitated while seated and are suitable for a wide range of physical abilities, they may serve as a cardiovascular exercise program for sedentary individuals who cannot, or will not, participate in more traditional forms of exercise.
Although both humor-based and simulated laughter are associated with positive health outcomes, the dose–response relationship to outcomes, long-term effects, and the underlying mechanisms and processes of laughter require further clarification (Mora-Ripoll, 2011, Proyer, Ruch, & Rodden, 2012). To the best of our knowledge, laughter has only been used as an additional behavioral modification to positively impact exercise adherence in one intervention (Hirosaki et al., 2013).
The purpose of this exploratory pilot study was to assess whether a novel PA program that incorporates simulated laughter exercises within a moderate-intensity strength, balance, and flexibility PA program would increase participation in PA, overall health and self-efficacy for PA among older adults residing in assisted living facilities (ALFs). Although simulated laughter has potential as an accessible, sustainable, and enjoyable modality to improve older adults’ PA program adherence and associated outcomes, no studies have examined the impact of simulated laughter as part of a dedicated PA program. The specific research aims and corresponding hypotheses that guided this research are as follows:
Aim 1: Increase overall health among older adults residing in ALFs.
(1) The LaughActive intervention will improve subjective health outcomes, or heath-related quality of life (HRQOL) measures of older adults residing in ALFs.
(2) The LaughActive intervention will improve objective health outcomes, or physical performance measures of older adults residing in ALFs.
Aim 2: Increase self-efficacy for PA, or the confidence to engage in PA, among older adults residing in ALFs.
(1) The LaughActive intervention will be positively associated with aspects of improved self-efficacy for PA among older adults residing in ALFs, including (a) physical, social, and self-evaluative outcome expectations for exercise; (b) increased perceived facilitators and reduced perceived barriers to exercise; and (c) exercise enjoyment.
Design and Methods
The 12-week study used a wait list control design with baseline and 6-week post-intervention comparisons within and between intervention groups. Researchers collected data from the intervention group at two points in time: Time 1 (pre-intervention baseline) and Time 2 (6-week intervention conclusion). Researchers collected data from the wait list comparison group members at three points in time: Time 1 (pre-intervention baseline), Time 2 (6-week waiting period conclusion; wait list comparison group intervention baseline), and Time 3 (6-week intervention conclusion). Each group engaged in one 6-week LaughActive intervention (described Intervention).
Participants and Recruitment
The study used a convenience sample of four comparable ALFs in terms of environmental variables (i.e., facility type, average monthly cost of residency, services offered, number of apartments, and number and types of PA activities offered in the facilities). The ALFs were for-profit with average monthly fees ranging from $3,675 to $4,895. Number of apartments ranged from 46 to 75. In addition to other activity programming, the facilities provided exercise classes twice a day, six times per week. A study of ALF facilities suggested that individual factors such as older age, comorbid conditions, reported ADL impairment, and moderate-to-severe cognitive impairment were more likely than facility factors to predict negative physical function (Giuliani et al., 2008). Facility names were randomly drawn to determine the intervention and control groups.
To identify individuals who were interested in study participation, 45-minute LaughActive resident demonstration sessions were conducted in place of the regularly scheduled morning exercise class at each site. Site Activity Directors selected residents with no more than moderate levels of cognitive impairment and placed the resident demonstration session flyers into eligible residents’ mailboxes. Session participants received a brief overview of the LaughActive program and forthcoming research study, followed by an interactive demonstration.
Participant recruitment sessions were conducted at each facility within 2 weeks following the demonstration sessions. Individuals who expressed interest in study participation were screened to determine if they were English-speaking, at least 60 years of age, and were able to get around with or without assistance from devices or one caregiver. Six of 43 potential participants screened were not eligible for further consideration, as the research team found that they were unable to perform the preliminary screening procedures due to attention or memory issues.
The American Heart Association (AHA)/American College of Sports Medicine (ACSM) Health/Fitness Facility Pre-participation Screening Questionnaire was used to determine participants’ risk stratification for experiencing a cardiovascular event while engaging in moderate-intensity exercise programming (ACSM, 2014). Based on participants’ responses to this interview-assisted questionnaire, participants were classified as low, moderate, or high risk for experiencing a cardiovascular event during exercise participation. According to the screening protocol, participants with one or more symptoms of, or who had been diagnosed with cardiovascular, pulmonary, and/or metabolic disease were considered to be at high risk and were advised to obtain physician’s clearance before beginning the LaughActive program (Balady et al., 1998). Regardless of participants’ risk status for experiencing a cardiovascular event while engaging in moderate-intensity exercise, all study participants were given a copy of a medical release form in order to consult with their physicians before participating in the LaughActive intervention. The study was approved by the Georgia State University Institutional Review Board, and all study participants provided written informed consent.
Intervention
This LaughActive intervention is a 6-week exercise program delivered twice weekly for 45 minutes each session using two progressive exercise routines. LaughActive is a moderate-intensity exercise program for older adults that combines simulated laughter exercises with a dedicated strength, balance, and flexibility exercise program. Laughter exercises and deep breathing techniques are interspersed throughout the exercise program and are positioned to participants as “laughter and deep breathing breaks.”
The strength, balance, and flexibility components of the intervention coincide with the ACSM/AHA PA recommendations for older adults (Nelson et al., 2007). In developing the two exercise routines that were used for the intervention, these older adult–specific guidelines were followed in terms of the session format, the selection of exercises for the program, the progression of the exercises within the class sessions, and the progressive advancement of exercise difficulty from the first to second routine (weeks 1–3 and weeks 4–6, respectively). Each session included 5–10 minutes of warm-up exercises followed by 30–35 minutes of intensive repetitive exercises, before concluding with 5–10 minutes of cool down and stretching.
Although LaughActive is not a dedicated endurance program, it may have elements of aerobic benefit. The physical act of laughter is comparable with mild cardiovascular exercise and shares many common physiological benefits associated with exercise (Fry, 1994). Facial, respiratory, and laryngeal muscles are all used to produce laughter, which creates changes in lung volume and muscle compression in the airways. This may cause physiological changes that necessitate increased oxygen consumption and in turn, raise the heart rate (Buchowski et al., 2007). Intense laughter elicited through laughter exercises used in LaughActive may be equivalent to the short aerobic bursts that occur in interval training, in which the exercise intensity is varied within a single bout of exercise (Garber et al., 2011). The interval training model consists of a series of maximal effort sprints with a period of lower-intensity active recovery between each series (Metcalfe, Babraj, Fawkner, & Vollaard, 2012). Interval durations have been evaluated that range from 15 seconds to several minutes (Arnardóttir, Boman, Larsson, Hedenström, & Emtner, 2007). Interval and continuous duration endurance training produce similar effects in healthy adults (Garber et al., 2011). Some studies have demonstrated similar efficacy of interval training and traditional continuous duration endurance training in a number of cardiorespiratory fitness and cardiometabolic biomarkers in participants with metabolic, cardiac, or pulmonary disease (Beauchamp et al., 2010; Earnest, Blair, & Church, 2010; Guimarães et al., 2010; Rognmo, Hetland, Helgerud, Hoff, & Slørdahl, 2004; Warburton et al., 2005; Wisløff et al., 2007). The laughter exercises incorporated rhythmic movement of the major muscle groups while laughing. For instance, a laughter exercise might engage the biceps and triceps muscles by inviting participants to clean out limiting thoughts with “mental floss.” In this exercise participants imagine a giant string of floss passing in and out through the ears as participants flex and extend the arms out to the side, all while laughing. The LaughActive sessions included, on average, 8–10 laughter exercises lasting 30–60 seconds each. A laughter exercise was typically incorporated into the workout routine after every 2–4 strength, balance, and flexibility exercises.
The LaughActive intervention used dumbbell weights for upper body strengthening exercises and resistive body weight for lower body strengthening exercises. In accordance with industry recommendations, sessions included one set of 8–10 exercises with 10–15 repetitions for each exercise (Nelson et al., 2007). So that the intervention continued to remain at moderate intensity for each participant as gains were made in muscle strength, resistance was gradually progressed over the course of the intervention, ranging from 1 to 3 lb dumbbell weights and progressive body weight exercises, as tolerated by individual participants.
The first author facilitated all LaughActive exercise sessions and is qualified to facilitate safe and effective exercise sessions. Fitness-related certifications include Group Fitness Instructor (American Council on Exercise [ACE]); Senior Fitness Specialist (ACE); Laughter Yoga Teacher (Laughter Yoga International); and CPR/AED/First Aid (AHA). The two exercise routines that comprised this intervention were developed in partnership with the third author, an associate professor of Gerontology and a certified Personal Trainer and Group Fitness Instructor (National Exercise Trainers Association [NETA]). The intervention was supported by written protocol for both routines, and each session was facilitated according to its protocol with minimal variation from the written protocol between groups.
Strength exercises targeted the muscles of the shoulders, chest, back, biceps, triceps, forearms, wrists, abdominals, inner and outer thighs, hips, glutes, quadriceps, hamstrings, and the supporting tissues of the ankles. Due to functional limitations of study participants and the associated risk of falls, balance exercises were completed while seated. Balance exercises focused on strengthening key muscles involved in balance, such as the abdominals, quadriceps, hamstrings, calves, and the supporting tissues of the ankles. Static stretching techniques were incorporated into the cool down segment. Per industry recommendations, static stretches were held for 10–30 seconds and were repeated 3–4 times for each stretch (Nelson et al., 2007). Muscles that were stretched included the neck, shoulders, chest, back, hamstrings, calves, shins, and the supporting tissues of the ankles.
Outcome Measures
Data on the following measures were collected at baseline only:
Exercise Risk Stratification
The participants’ risk stratification for engaging in moderate-intensity exercise was determined using the AHA/ACSM Health/Fitness Facility Pre-participation Screening Questionnaire (ACSM, 2014).
Sociodemographic Variables
The sociodemographic variables included in the study are as follows: age, gender, race, education level, marital status, and physical activity participation frequency and type, height (inches), body weight (lb), and body mass index (BMI). Physical measurements were obtained using a standard measuring tape and scale. BMI (kg/m2) was determined using a BMI calculator.
Outcome measures were assessed at three points in time. Data were collected using paper and pencil interview-assisted questionnaires and an observational fitness test.
Subjective Health or HRQOL
Subjective health status was assessed using the SF-36v2 Health Survey Standard Form (4-week recall), a widely used, comprehensive, and validated measure of HRQOL (Ware et al., 2007). The SF-36v2 measures eight domains of health, including Physical Functioning ([PF] 10 items); Role-Physical or role participation with physical health problems ([RP] 4 items); Bodily Pain ([BP] 2 items); General Health [GH] 5 items); Vitality ([VT] 4 items); Social Functioning ([SF] 2 items); Role-Emotional or role participation with emotional health problems ([RE] 3 items); and Mental Health ([MH] 5 items). The SF-36v2 generates two types of summary scores for physical and mental health. All domains and the component scores use norm-based scoring.
Objective Health
Objective physical performance was measured using the Senior Fitness Test ([SFT] Rikli & Jones, 1999). The SFT assesses lower and upper body strength, aerobic endurance, lower and upper body flexibility, and agility/dynamic balance. Respectively, test items that measure these functional fitness domains include chair stand (repetitions/30 seconds); arm curl (repetitions of 5 lb weight for women and 8 lb weight for men/30 seconds); 2-minute step (steps/2 minutes); chair sit-and-reach (inches); back scratch (inches); and 8-foot up-and-go (seconds).
Perceived Physical, Social, and Self-evaluative Outcome Expectations for Exercise
Outcome expectations for exercise were assessed using the Outcome Expectations for Exercise (OEE) scale (Resnick, Zimmerman, Orwig, Furstenberg, & Magaziner, 2000). The OEE was developed to assess older adults’ perceived consequences of exercise behavior. The scale consists of nine statements regarding the benefits of exercising with high reliability (Resnick et al., 2000). For each statement, participants indicate the degree to which they agree with each statement (e.g., “Exercise makes my muscles stronger”) on a scale of 1 (strongly disagree) to 5 (strongly agree). The numerical ratings for each response are tallied and then divided by the number of responses. Higher scores indicate higher levels of outcome expectations for exercise.
Perceived Facilitators and Barriers to Exercise
The Self-Efficacy for Exercise (SEE) scale measured perceived facilitators and barriers to exercise (Resnick & Jenkins, 2000). The SEE is a 9-item scale designed to measure participants’ perceived confidence in their ability to exercise three times per week for 20 minutes despite the presence of commonly identified barriers to participation among older adults, such as pain or fatigue. For each item, participants indicate their confidence to execute exercise behavior on a 10-point scale ranging from 0 (not confident) to 10 (very confident). The score is obtained by summing the numerical ratings for each response and then dividing by the number of responses. Higher scores indicate stronger levels of self-efficacy expectations for exercise. This measure has been shown to have high reliability (Resnick & Jenkins, 2000).
PA Enjoyment
Participants’ feelings of enjoyment in response to PA were assessed using the Short Physical Activity Enjoyment Scale (8-Item PACES; Mullen et al., 2011). Respondents are asked to rate “how you feel at the moment about the physical activity you have been doing” using a 7-point bipolar rating scale. Higher PACES scores reflect greater levels of enjoyment. The measure has been shown to have high reliability (Mullen et al., 2011).
Program Adherence/Participant Adherence
Participant adherence was measured by the percentage of participant program attendance. These measurements were tracked via a roll sheet in which the exercise instructor documented attendance. Participation was tallied according to percentage of each class attended (i.e., 100% for full class, 75% if participant arrived after the warm-up, 50% for half of class, and 25% if participant arrived for stretching only). Participant adherence was calculated by summing the total number of classes attended and dividing by 12 total sessions.
Program Satisfaction
The Satisfaction Questionnaire included open- and close-ended questions asking participants to assess the LaughActive program.
Measurements were collected by the first author (LaughActive instructor), second author, and a team of six graduate research assistants. In order to reduce participants’ response bias, members of the research team who were not involved in facilitating the LaughActive exercise sessions assessed program satisfaction.
Statistical Analyses
Independent samples t tests were used to determine baseline differences between the intervention and wait list comparison groups. Paired sample t tests were used to assess change between pre- and post-test results on intervention participants and wait list comparison group members. Individuals with missing data on outcomes were excluded pairwise; no imputation was done. IBM SPSS Statistics for Windows, Version 21.0 (IBM Corp., 2012) was used to calculate the variations in all pairs of determined study variables. Given the relatively small sample size of this pilot study, the relatively large effect sizes needed to achieve statistical significance in a small sample and the targeted number of variables compared over time, the decision was made to set the alpha level to less than .10 with no Bonferroni adjustment made.
The SF-36v2 Health Survey was scored using the QualityMetric Health Outcomes Scoring Software 2.0. The SFT was scored using the Senior Fitness Test Scoring Software 2.0.
Results
Thirty-seven participants from across four recruited sites were included in the study (see Figure 1 for participant flow diagram). A total of 34 participants were initially recruited at the Time 1 baseline recruitment sessions. Two sites participated in the intervention from Time 1 to Time 2. The other two sites, during this Time 1 to Time 2 period, provided the wait list comparison group members. From Time 2 to Time 3, the latter two sites contributed intervention participants. The majority of these participants from the original control sites had been wait list comparison group members. Three participants, who had not been wait list comparison group members, were added at Time 2.
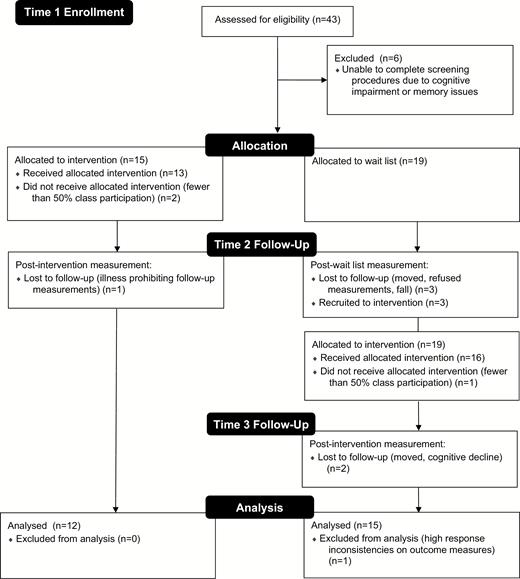
LaughActive intervention participant recruitment and participation.
Three participants did not receive the allocated intervention due to fewer than 50% program participation. Six participants were lost to follow-up. Reasons for loss to follow-up were fall or medical condition since baseline assessment prohibiting exercise participation and observational fitness test evaluation (n = 2), significant cognitive decline since pre-intervention measurement (n = 1), moved out of the ALF (n = 2), and refusal to complete follow-up measurements (n = 1). No participants withdrew from the study for reasons directly related to the LaughActive program and no adverse events were reported. Of the 28 study participants who completed measurements, one participant was excluded from the final analyses due to high inconsistencies in responses, as determined by the SF-36v2 Health Survey Response Consistency Index (RCI) data quality indicator.
The mean number of classes attended was 9.85 (SD = 2.09; range = 4–12). The majority of participants (22 or 81.4%) who were included in the final analyses (n = 27) attended at least 75% of the LaughActive program. The LaughActive participant adherence rate is consistent with other findings of exercise program attendance in older adult populations ranging from 60 to 90% (Resnick, Luisi, & Vogel 2008). In fact 48.1% of the sample attended more than 90% of the program, whereas only 14.8% attended less than 60% of the program.
Descriptive characteristics of the sample (n = 27) are presented in Table 1. The mean age was 81.55 years (SD = 7.48) and the mean BMI (n = 25) was 27.40 (SD = 4.93). The majority of study participants were Caucasian (88.9%), women (81.5%), not married or living with a partner (84.6%), and college educated (74.1%) and exercised at least 5 days per week (55.5%). Independent samples t tests indicated that there were no significant differences in sociodemographic variables between the intervention and wait list comparison groups at baseline.
Sociodemographic Characteristics of Participants Who Completed the LaughActive Intervention
| Completed (n = 27)n (%) | |
|---|---|
| Age (years) | |
| 60–70 | 3 (11.1) |
| 71–80 | 3 (11.1) |
| 81–90 | 19 (70.3) |
| 91–100 | 2 (7.4) |
| Gender | |
| Male | 5 (18.5) |
| Female | 22 (81.5) |
| Race | |
| White (not Hispanic) | 24 (88.9) |
| Black/African American (not Hispanic) | 3 (11.1) |
| Education | |
| Some high school/high school graduate | 7 (25.9) |
| Some college/college graduate | 16 (59.3) |
| Graduate education | 4 (14.8) |
| Partnership status | |
| Married/living with partner | 4 (15.4) |
| Other | 23 (84.6) |
| Exercise class participation | |
| Do not participate | 2 (7.4) |
| 1 day per week | 5 (18.5) |
| 2 days per week | 2 (7.4) |
| 3 days per week | 1 (3.7) |
| 4 days per week | 2 (7.4) |
| 5 days per week | 3 (11.1) |
| More than 5 days per week | 12 (44.4) |
Table 2 shows the baseline and end point retest scores for the health and self-efficacy measures for all participants during their intervention period. We observed statistically significant within-group improvements in mental health (p = .056), aerobic endurance (p = .036), and outcome expectations for exercise (p = .006) in the intervention participants. We observed statistically significant within-group declines (p = .026) in agility and dynamic balance (8-foot up-and-go test). The wait list comparison group also significantly declined (p = .053) in this measure during the control period.
Within-group Change of Outcomes From Baseline to End Point for LaughActive Participants
| Outcomes | Baseline | End point | |
|---|---|---|---|
| M (SD) | M (SD) | p Value | |
| Subjective health (n = 27) | |||
| SF-36v2 | |||
| PCS | 46.76 (9.09) | 47.05 (8.05) | .844 |
| PF | 42.72 (10.07) | 42.58 (10.52) | .942 |
| RP | 47.67 (9.51) | 48.75 (8.62) | .529 |
| BP | 52.51 (9.62) | 53.15 (9.02) | .692 |
| GH | 53.36 (8.80) | 54.27 (8.21) | .386 |
| MCS | 56.12 (8.32) | 57.59 (6.86) | .262 |
| VT | 56.11 (9.95) | 57.87 (10.46) | .332 |
| SF | 51.95 (9.00) | 52.32 (8.45) | .864 |
| RE | 50.88 (8.15) | 50.88 (7.25) | 1.000 |
| MH | 54.35 (8.91) | 56.68 (5.68) | .056* |
| Objective health | |||
| SFT | |||
| Chair stand (n = 23) | 6.78 (3.04) | 7.04 (3.03) | .756 |
| Arm curl (n = 27) | 10.40 (4.05) | 9.92 (3.48) | .589 |
| 2-Minute step (n = 25) | 55.66 (21.34) | 64.33 (23.66) | .036** |
| Chair sit-and-reacha (n = 26) | −3.42 (3.61) | −4.26 (3.97) | .114 |
| Back scratcha (n = 25) | −6.80 (5.41) | −6.51 (5.01) | .687 |
| 8-Foot up-and-gob (n = 25) | 13.53 (6.48) | 15.10 (7.38) | .026** |
| Self-efficacy (n = 27) | |||
| OEE | 4.09 (.60) | 4.35 (2.34) | .006** |
| SEE | 6.43 (2.34) | 6.85 (2.12) | .404 |
| PACES | 20.18 (9.81) | 17.44 (8.84) | .227 |
Notes: BP = Bodily Pain; GH = General Health; MCS = Mental Component Summary; MH = Mental Health; OEE = Outcome Expectations for Exercise Scale; PACES = Physical Activity Enjoyment Scale; PCS = Physical Component Summary; PF = Physical Functioning; RE = Role-Emotional; RP = Role-Physical; SEE = Self-Efficacy for Exercise Scale; SF = Social Functioning; SFT = Senior Fitness Test; VT = Vitality.
aScores further from 0 in the negative direction indicate worse outcomes.
bHigher scores indicate worse outcomes.
*p < .10; **p < .05 indicate significance of group difference from baseline (paired sample t test, two-tailed).
Satisfaction scores for participants (n = 27) are presented in Table 3. Unanimously, participants were satisfied with the program and enjoyed being in class. Respondents indicated that they found laughter to be an enjoyable addition to a traditional exercise program (96.2%). Moreover, 88.9% of respondents stated that the laughter helped to make exercise more accessible, and the same proportion also found that the program enhanced their motivation to participate in other exercise classes or activities. All participants stated that they felt better overall, and 92.6% found more joy in their lives as a result of the LaughActive program. Furthermore, 88.9% of respondents wanted to continue the program two times per week.
Satisfaction Questionnaire Results for LaughActive Participants
| Description | n = 27 | |
|---|---|---|
| Outcome variables (4-point scale, where strongly agree = 4) | M (SD) | Agree or strongly agree (%) |
| I am satisfied with the LaughActive program | 3.56 (.506) | 100 |
| As a result of the LaughActive program, I feel better overall | 3.41 (.501) | 100 |
| As a result of the LaughActive program, I find more joy in my life | 3.19 (.557) | 92.6 |
| The LaughActive program was appropriate for my physical fitness level | 3.44 (.577) | 96.2 |
| I found the laughter aspect of the LaughActive program to be an enjoyable addition to a traditional exercise program | 3.44 (.577) | 96.2 |
| The laughter aspect of the LaughActive program helped to make exercise more accessible for me | 3.19 (.622) | 88.9 |
| The LaughActive program enhanced my interaction with my classmates during the exercise classes | 3.30 (.724) | 85.1 |
| The LaughActive program enhanced my interactions with others outside of class | 3.00 (.734) | 81.5 |
| The LaughActive program enhanced my motivation to participate in other exercise classes or activities | 3.26 (.656) | 88.9 |
| I would like to continue participating in the LaughActive program | 3.37 (.688) | 88.8 |
| I would like to continue participating in the LaughActive program two times per week | 3.26 (.656) | 88.9 |
| I would like to continue participating in the LaughActive program three times per week | 2.67 (.734) | 51.8 |
| I would recommend the LaughActive program to a friend | 3.44 (.577) | 96.2 |
| Outcome variables (3-point scale, where often = 3) | M (SD) | Sometimes or often (%) |
| I felt comfortable approaching my instructor with questions or comments | 2.67 (.555) | 96.3 |
| I liked the instructor’s teaching approach | 2.89 (.320) | 100 |
| I was satisfied with the way my instructor taught the classes | 2.93 (.267) | 100 |
| I enjoyed being in class | 2.93 (.267) | 100 |
| I felt that I was a valued and respected member of the class | 2.85 (.362) | 100 |
Several themes emerged from analysis of participants’ responses to the open-ended questions. These responses included appreciation of the following aspects of the LaughActive intervention: interaction with peers; mood benefits; enjoyment/fun; laughter; the program as different; and appreciation of the instructor’s equating the exercises with functional movements needed to perform ADLs. Respondents specifically referenced the laughter aspect of LaughActive, as well as their appreciation of the idea of integrating laughter into an exercise program. Examples of these statements include “I love to laugh and this gives me more of a chance to do that”; “I don’t laugh enough. I appreciated the program”; “It’s a great idea, combining laughter with the exercise”; and “Laughing is a good thing for the geriatric population. This needs to be offered at senior centers.”
Discussion
In assessing the impact of a 6-week laughter-based PA program, we found statistically significant improvements in mental health, aerobic endurance, and outcome expectations for exercise in the intervention participants. Aim 1 was partially supported in that statistically significant within-group improvements were observed in mental health (MH) and aerobic endurance (2-minute step test). The 5-item MH domain measures the four major mental health dimensions of anxiety, depression, behavioral/emotional control, and psychological well-being. Higher scores indicate improved states of peace, happiness, calmness, and behavioral/emotional control (Ware et al., 2007). These significant improvements in mental health are supported by Satisfaction Questionnaire findings.
The improvements in aerobic endurance require further exploration because LaughActive could not be considered an endurance program in the traditional sense because the program did not incorporate activities that increase the heart rate and breathing for a continuous period of at least 10 minutes (Bauman et al., 2016). Instead the heart and breathing rate were increased through the 30- to 60-second aerobic bursts throughout the session in the form of laughter exercises. Given that this was a multimodal strength, balance, and flexibility program that included laughter, it is difficult to differentiate which mode(s) of exercise contributed to the increase in aerobic endurance. As Bauman and colleagues (2016) state, “Notably, aerobic capacity improves after isolated resistance training in older adults, because strength and muscle mass contribute to aerobic capacity, and thus resistance training may subsequently result in increased ability to engage in endurance activities like walking” (p. S275).
The LaughActive program aimed to improve self-efficacy for PA by improving outcome expectations for exercise, increasing perceived facilitators and reducing perceived barriers to exercise, and enhancing exercise enjoyment. Aim 2 was partially supported in that statistically significant within-group improvements (p = .006) were observed in outcome expectations related to exercise (OEE). Outcome expectations play an important role in influencing older adults’ exercise adoption and maintenance of exercise behaviors, and in fact may be better predictors of exercise behavior than beliefs regarding the ability to continue exercising despite perceived barriers (Resnick et al., 2008).
LaughActive was intended to serve as a program that would improve outcome expectations for exercise by both educating participants on the benefits of exercise and helping them to experience enjoyment through laughter. Throughout the sessions, the instructor narrated the health benefits of engaging in regular exercise (e.g., exercise strengthens muscles and bones), as well as the benefits of each exercise on functional performance (e.g., this exercise helps us to get in and out of a chair more efficiently). Given the statistically significant increase in MH domain scores and feedback on the Satisfaction Questionnaire, it is clear that participants experienced enhanced joyful affective states during this program, which in turn could have positively impacted outcome expectations (Jette et al., 1998; Resnick & Jenkins, 2000; Resnick et al., 2008).
Simulated laughter interventions have been shown to positively impact mental health outcomes in older adults (Ko & Youn, 2011, Shahidi et al., 2011). In our study, we observed statistically significant increases in mental health and outcome expectations for exercise that may have motivated continued participation. However, we did not see a significant impact on enjoyment, or a relationship between the number of classes attended and mental health (MH), outcome expectations (OEE), or enjoyment (PACES). Therefore, it is unclear in our study what role these outcomes play in exercise adherence. This unclear pathway warrants future research.
Limitations
Despite the study’s strengths, there were several limitations. The findings of the study are limited by small sample size and selectivity. Although the sample of participants included in the final analyses (n = 27) met the requirements of power calculation (n = 21), it was relatively small, given the number of study outcomes. Future studies would likely benefit from a larger probability sample and a randomized rather than wait-listed control group. We used a convenience sample, which may be biased by overrepresentation or underrepresentation of particular groups of people. Although this sample was likely representative of the average ALF resident in terms of age, gender, race, and education, the sample was fairly homogenous, as the majority of the study participants were Caucasian, women, and well educated. Furthermore, the ALF sites selected for this intervention all had established exercise programs with twice-daily exercise classes 6 days per week. Therefore, these findings cannot be generalized to a more heterogeneous sample of older adults, or to other ALFs without established exercise programs.
This intervention was designed to improve participant adherence to PA programming. However, we were not able to obtain data on participants’ regular exercise class attendance other than baseline and follow-up self-report measures, nor could we control for exercise attendance outside of the LaughActive program. It is possible the results of the study could be partially attributed to attendance in other exercise programs, but it is not likely. Participants were residing in ALFs that provided exercise programming that met twice daily, 6 days per week. We substituted two morning classes with the LaughActive programming. We assume that the level of other exercise participation remained constant before, during, and after the intervention. This should be a conservative assessment of LaughActive programming impact because the majority of participants were already engaged in exercise programming at the onset of the intervention.
The lack of additional statistically significant findings in physical performance measures may be related to the instrument selected to measure efficacy of this intervention for this study population. Although the SFT is suitable for use with dependent older adults who need assistance with basic ADLs, the instrument was designed to assess the physical performance capacity of independent, community-dwelling adults (Rikli & Jones, 2013). The instrument uses continuous-scale scores, which can accommodate a wide range of physical ability levels. However, many of the fitness tests were too difficult for this study population to perform, resulting in the need for modifications in performance of the tests. The frequent use of modifications was problematic for scoring the SFT and, subsequently, measuring change over time.
Due to the exploratory nature of this study, the first author facilitated the LaughActive class sessions and collaborated in both data collection and analysis. The impact of this potential bias is mitigated, as a team that included the first author, second author, and six graduate research assistants collected measurements.
Future Research
PA experts contend that further well-designed research is needed to clarify varying levels of dose–response across diverse populations, medical conditions, and risk factors; establish minimum and maximum thresholds for activity; and measure varying intensities of PA (Hughes et al., 2011). Future laughter studies are needed to better outline underlying laughter mechanisms and processes and derive theoretical models for testing (Proyer et al., 2012). These substantial contributions would provide a framework for evaluating the dose–response relationships of laughter on outcomes.
Implications
It is well demonstrated that exercise is important for maintaining health and independence, yet many older adults are not sufficiently active to gain the associated health benefits, and inactivity remains a major public health concern. Programs are needed that promote optimal physical functioning and prevent or delay deficits that lead to increased disability and loss of functional independence, and in the case of ALF residents, costly and unwanted transfer to nursing homes (Giuliani et al., 2008). PA interventions that emphasize enjoyment through eliciting positive emotions among program participants have potential to motivate a largely sedentary older adult population to adopt and adhere to exercise behaviors that contribute to maintaining functional independence. Simulated laughter as part of a dedicated PA program may transform exercise into an enjoyable experience for older adults by helping them to laugh unconditionally, experience positive emotions, and associate these positive emotions with their experience of exercise participation. These joyful affective experiences may influence outcome expectations for PA and predict ongoing adherence.
Further well-designed research is needed to better understand the underlying mechanisms of laughter and substantiate the dose–response relationship of laughter and its associated health benefits. This research is one of few studies to evaluate the potential of simulated laughter in improving health outcomes among older adults, and the first evaluation of a dedicated PA program that incorporated simulated laughter. This pilot study demonstrated promising results and may spark more research to evaluate the potential of simulated laughter in conjunction with PA as a viable technique for enhancing the health and adherence outcomes of PA programs.
Acknowledgments
Many thanks to the assisted living facility staff, study participants, and research assistants who dedicated their time and energy to this evaluation. The authors report no conflict of interest and declare no financial interest.
References
Author notes
Present address: LaughActive, LLC, Atlanta, GA.
Decision Editor: Rachel Pruchno, PhD

